AlwaysRecover logo
AlwaysRecover Press-safe analysis • DRaaS • Recovery speed

Research Brief + Chart Pack

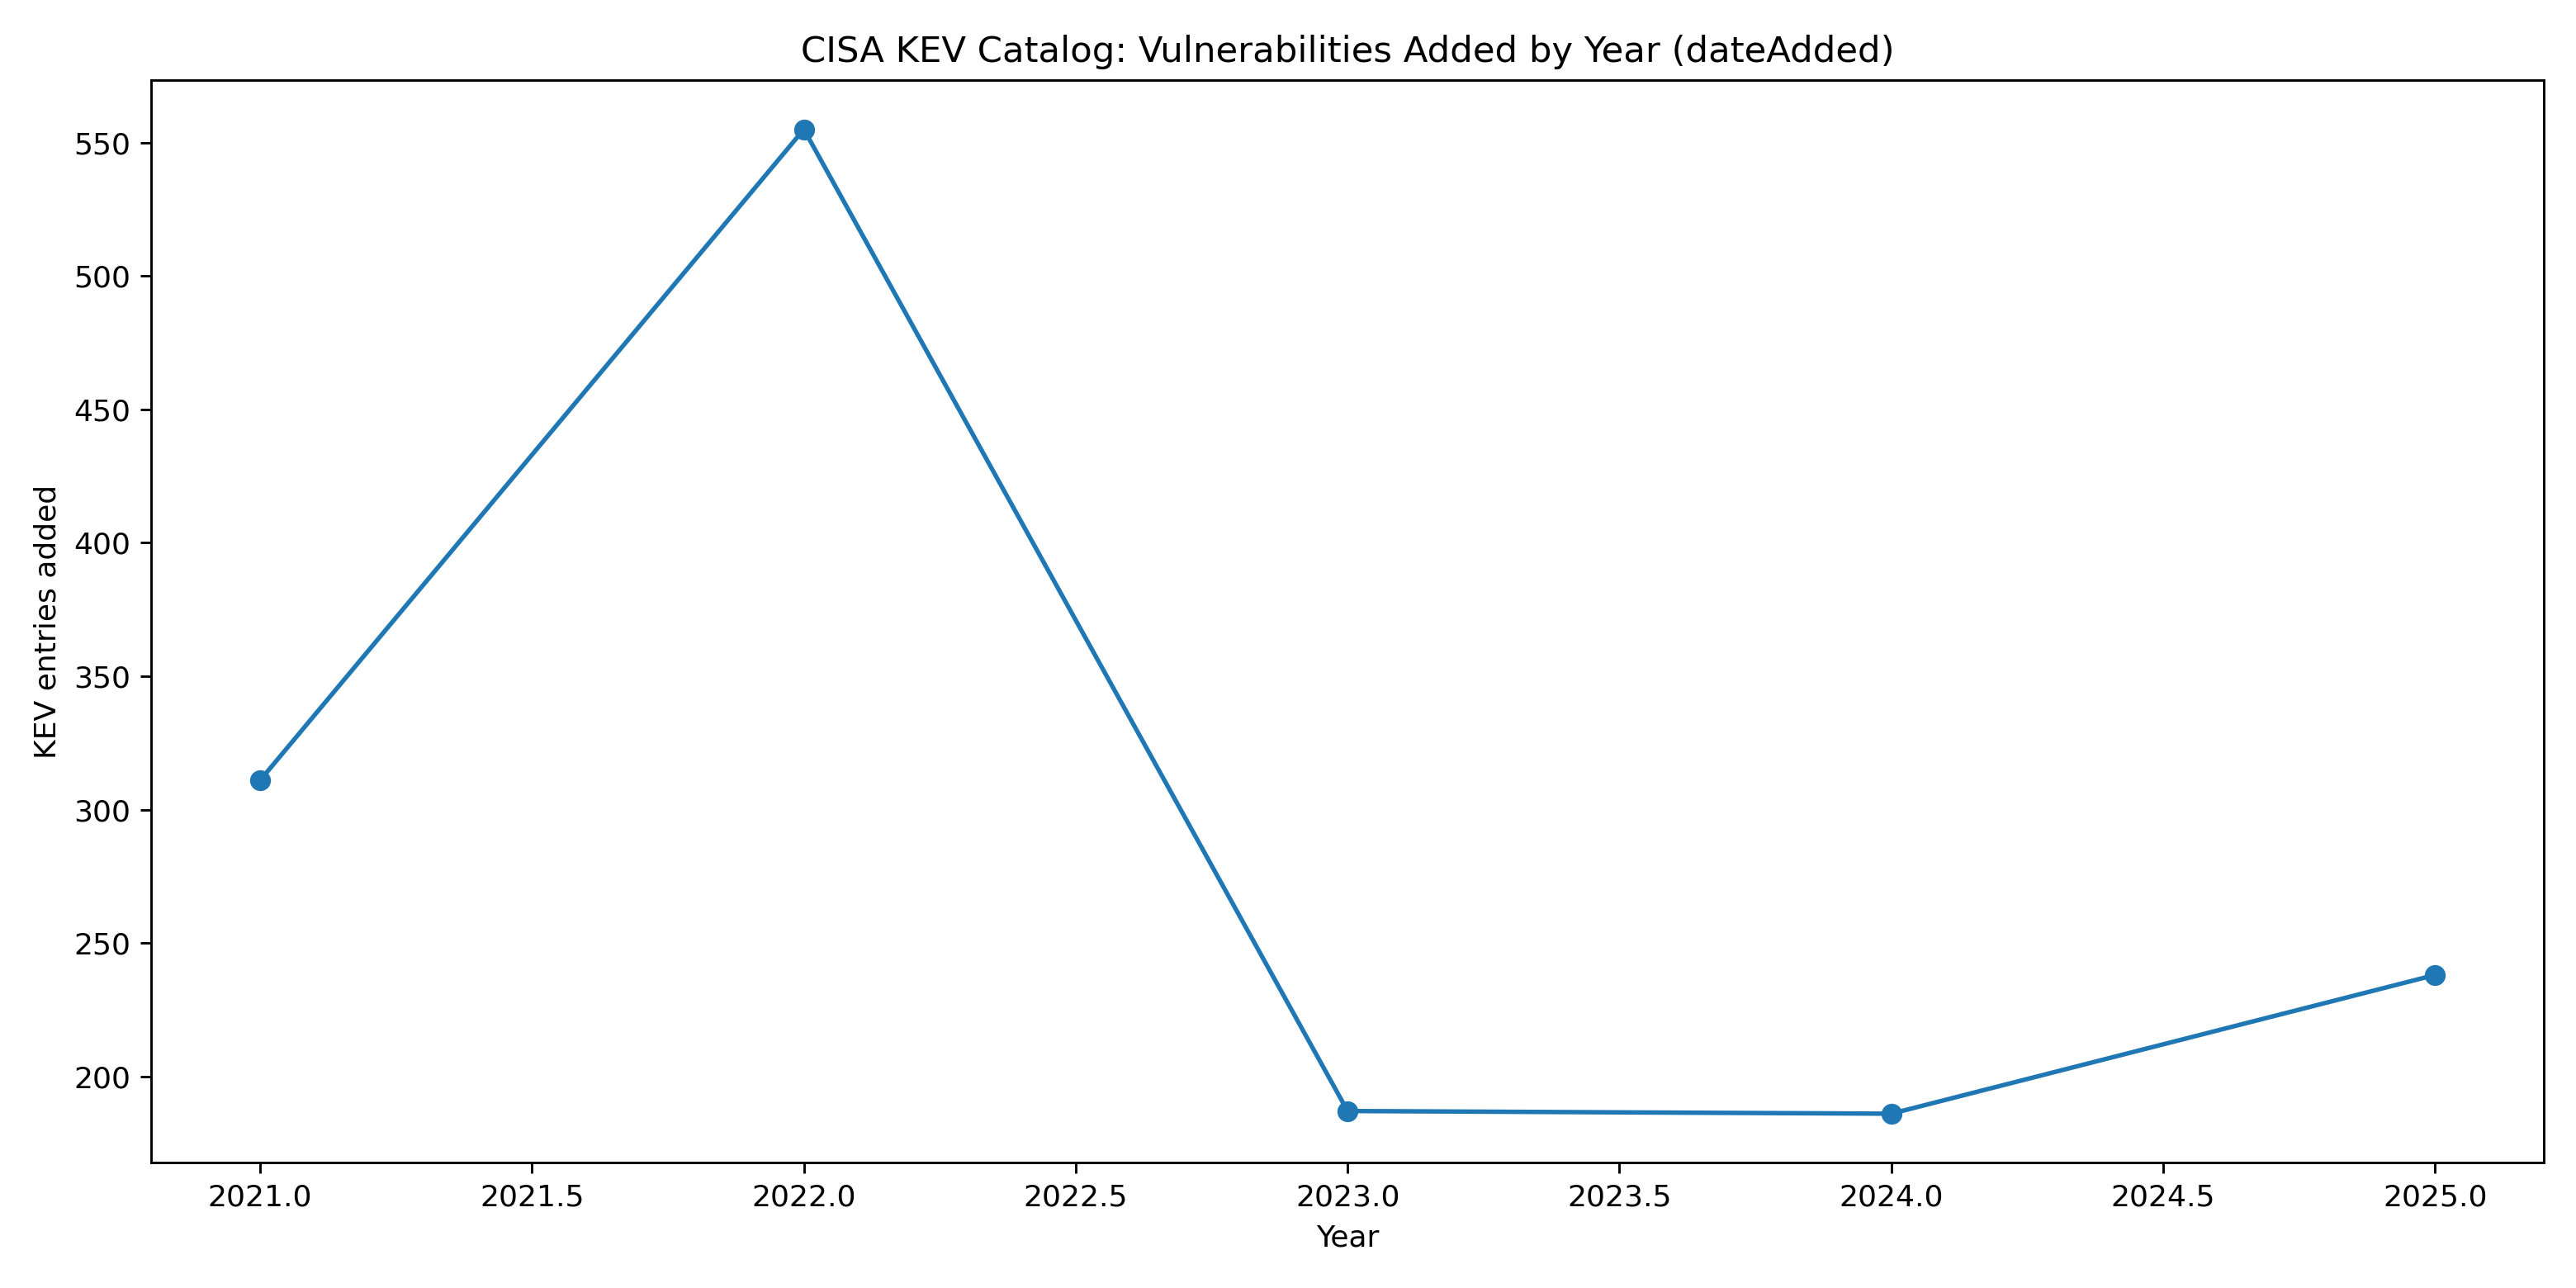
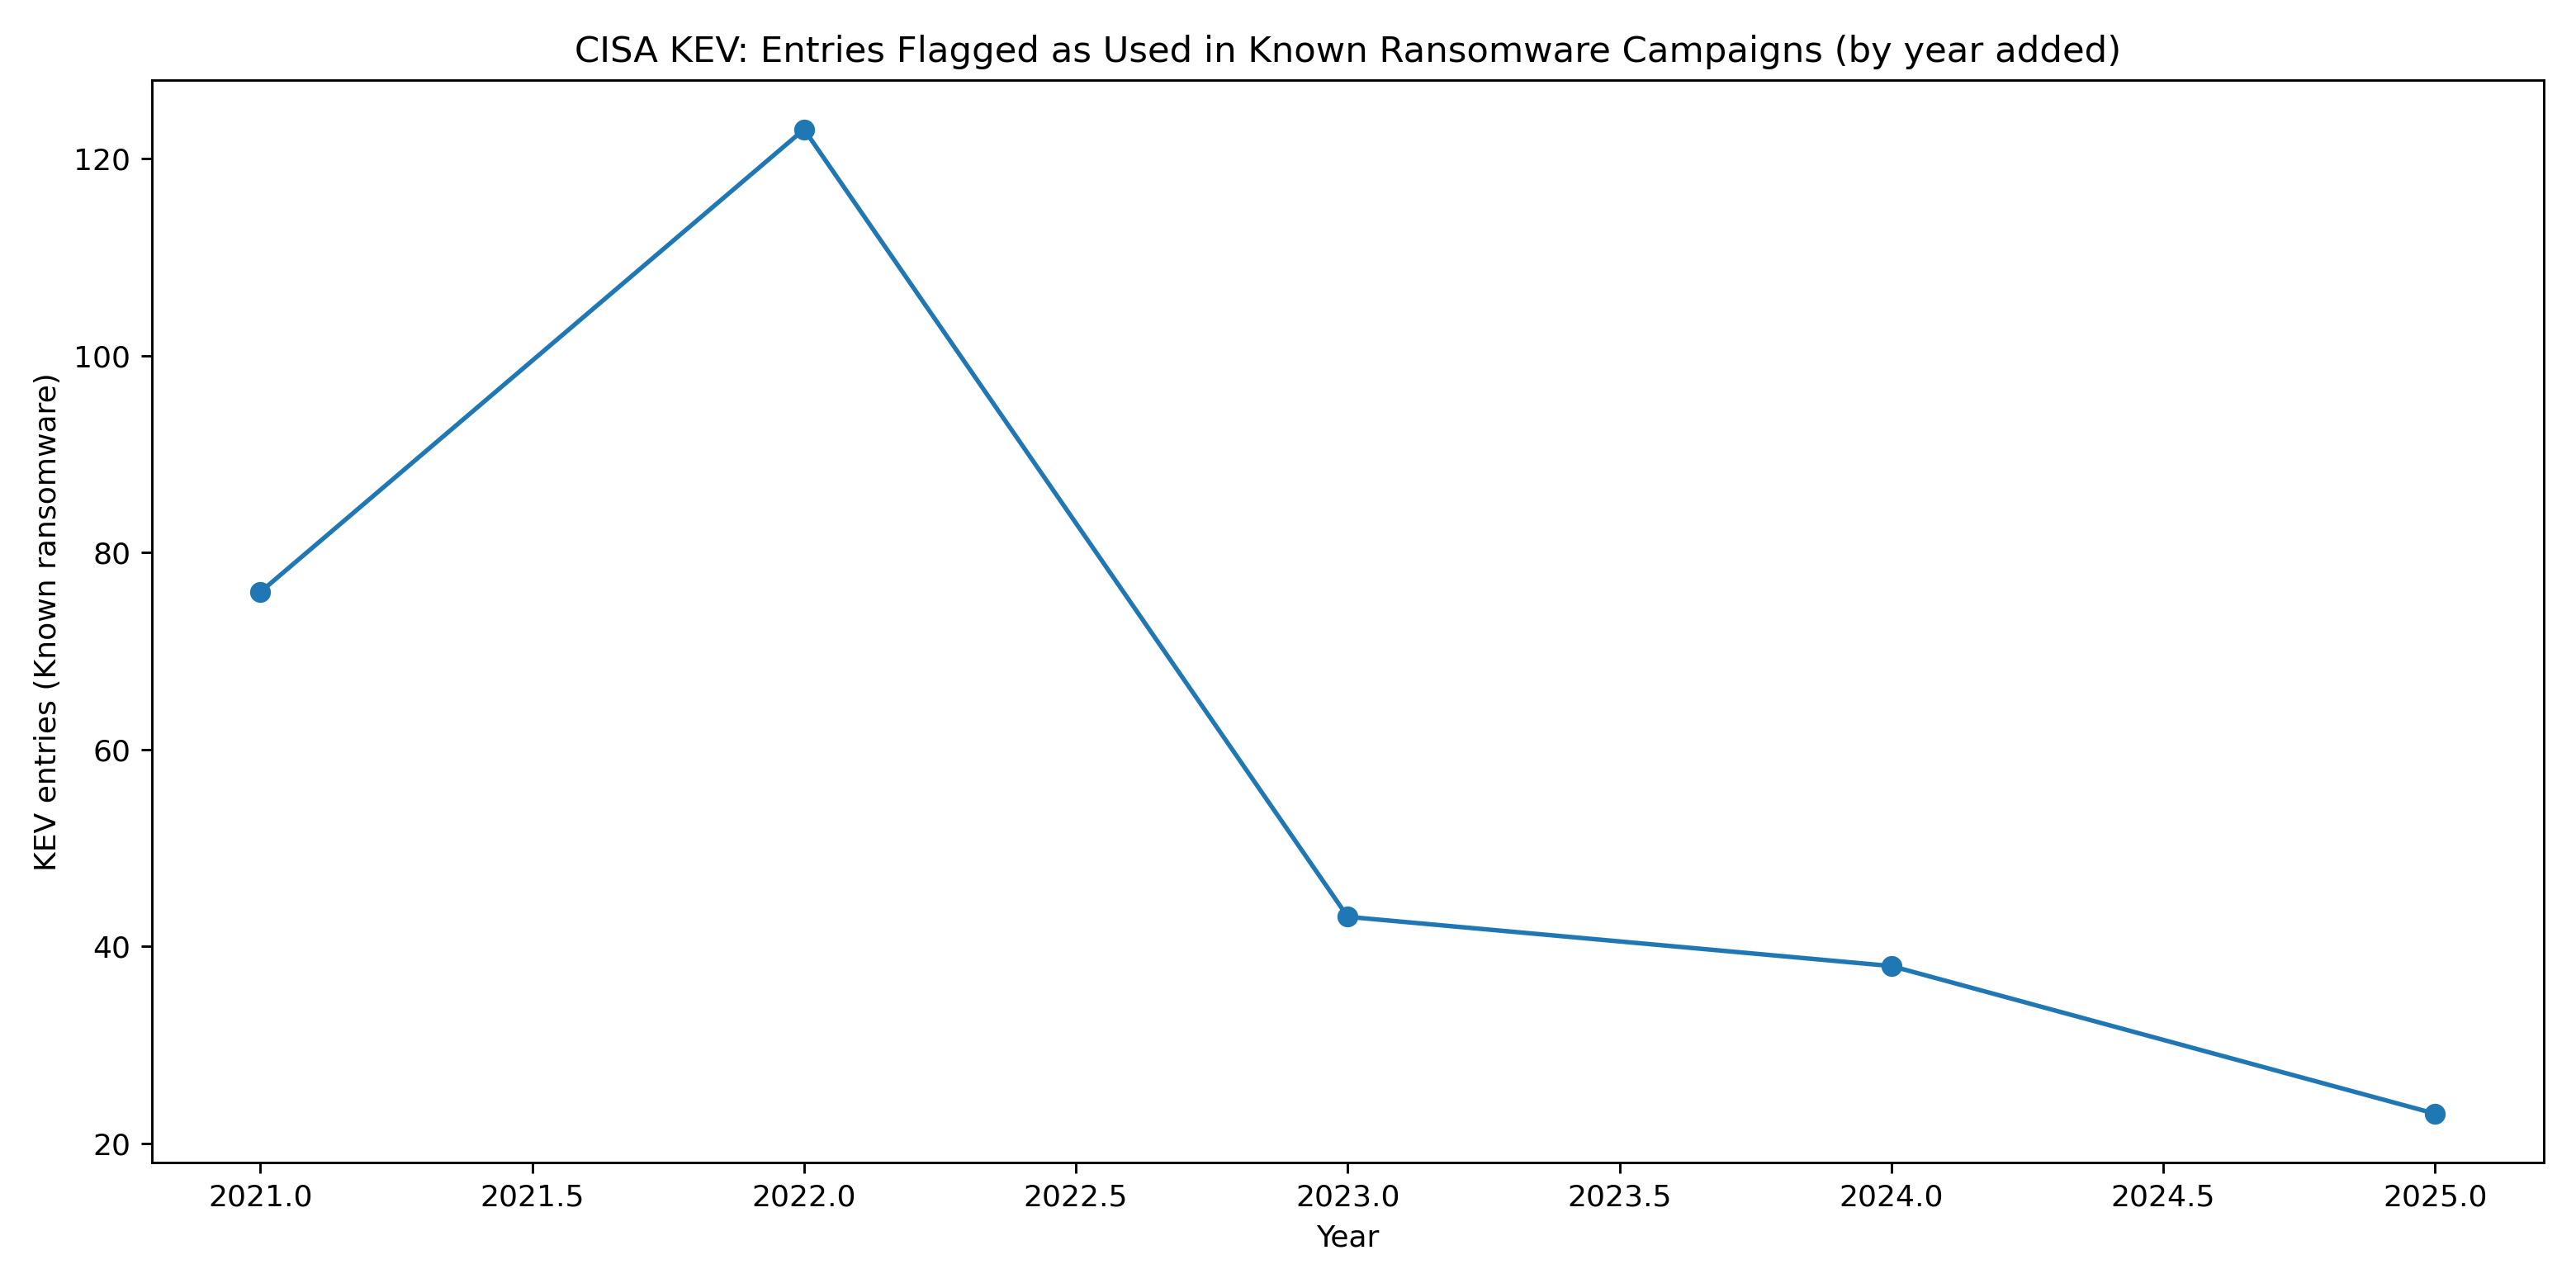
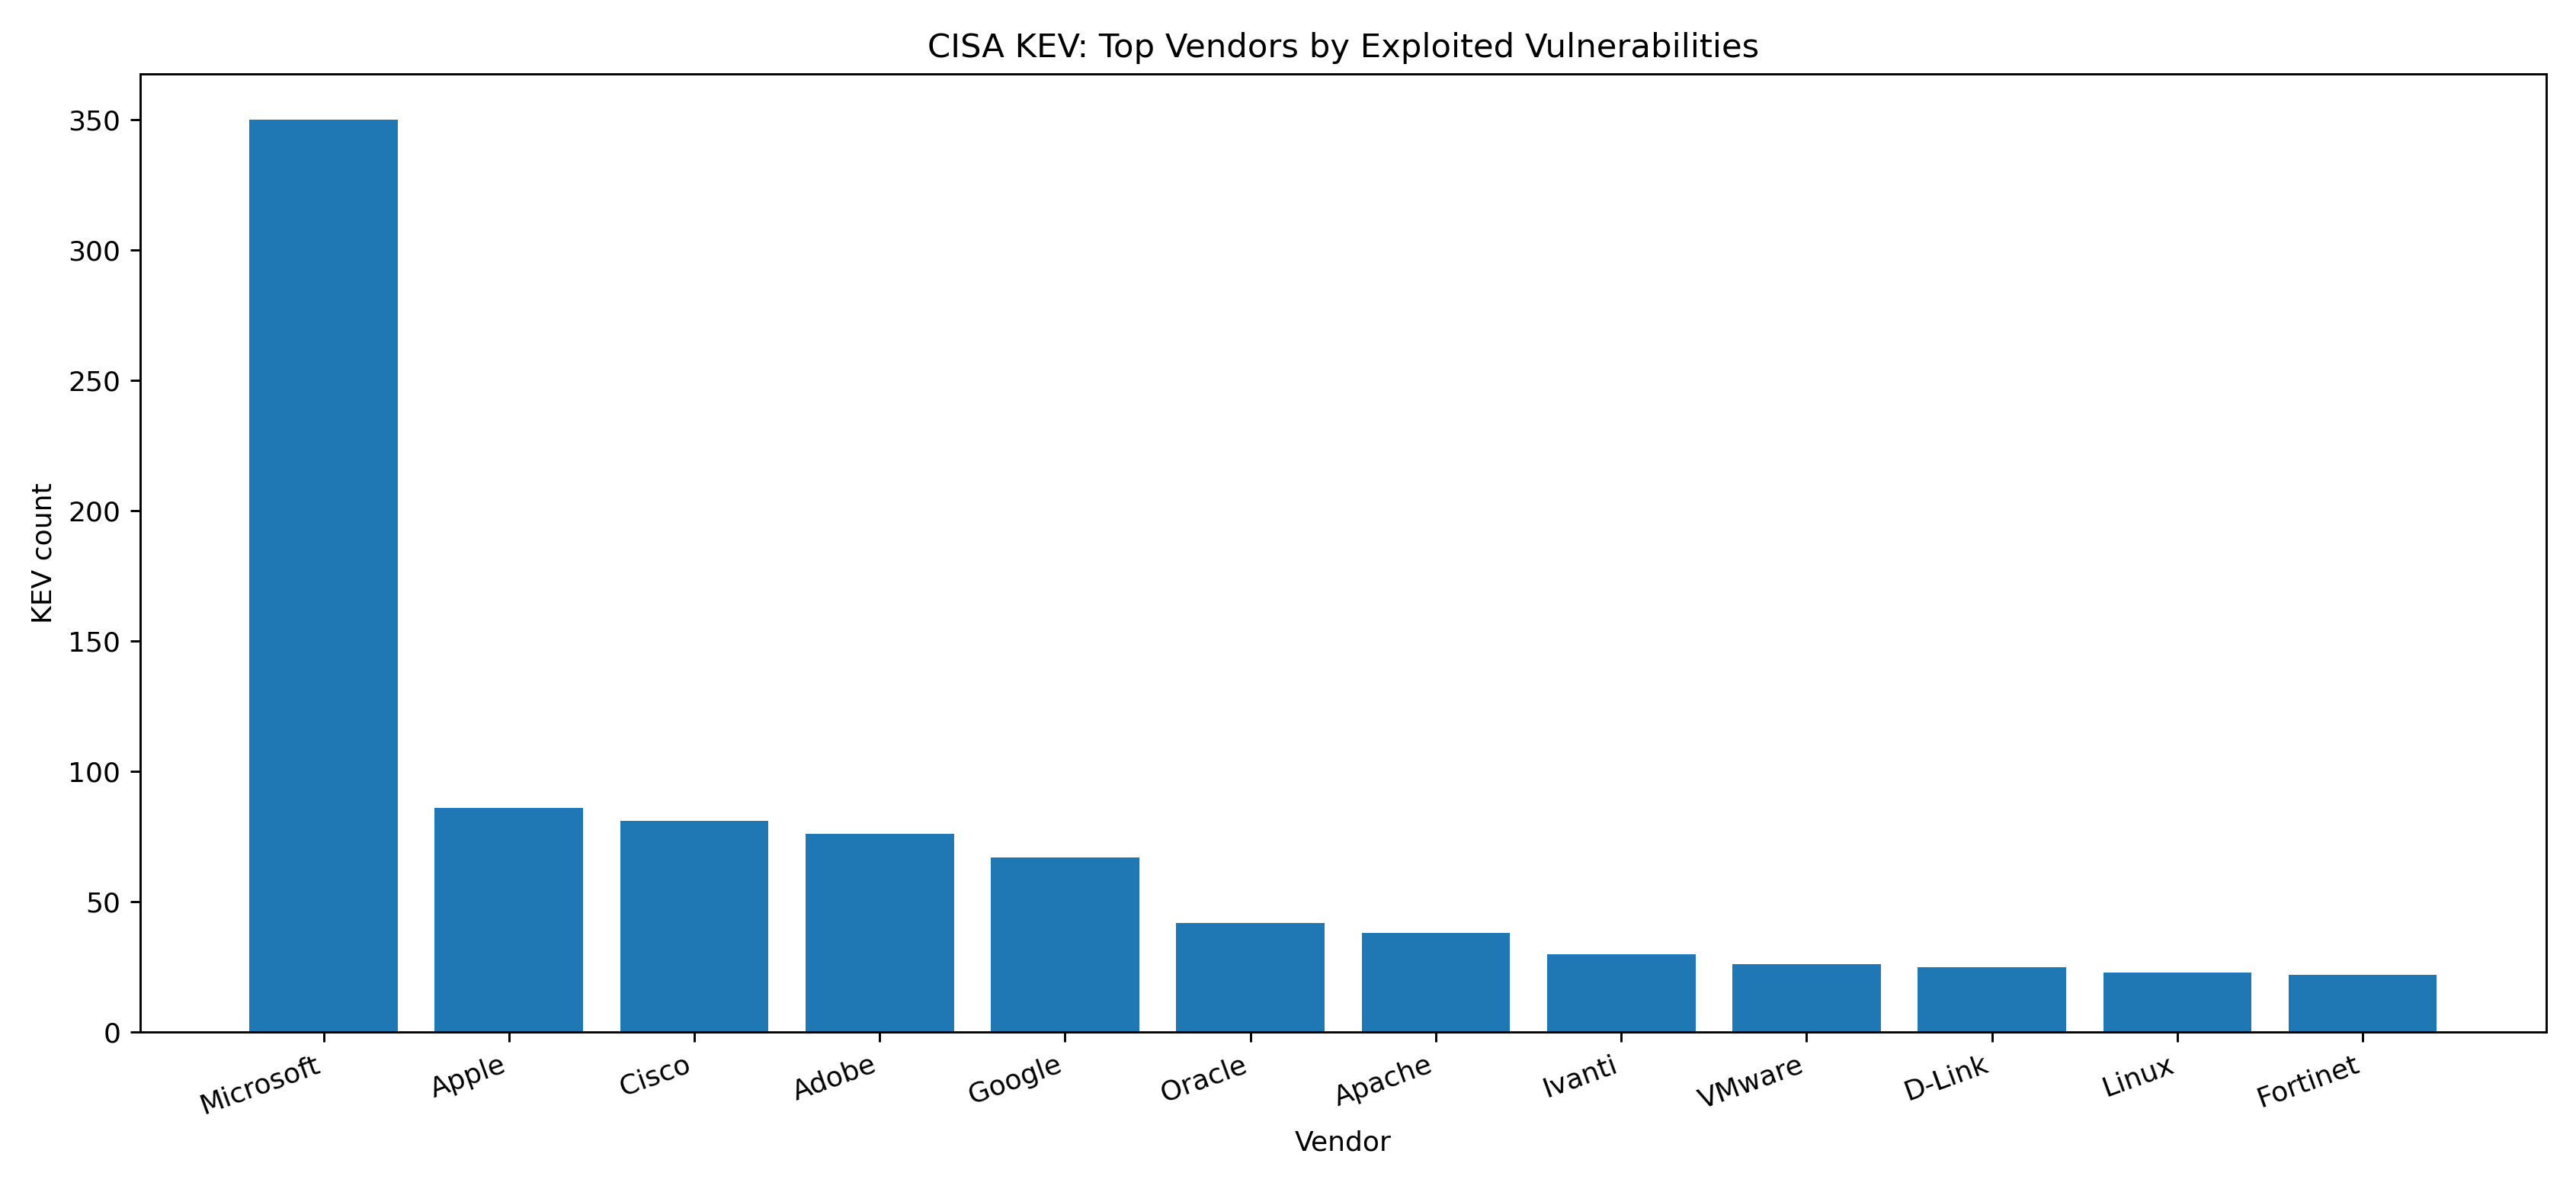
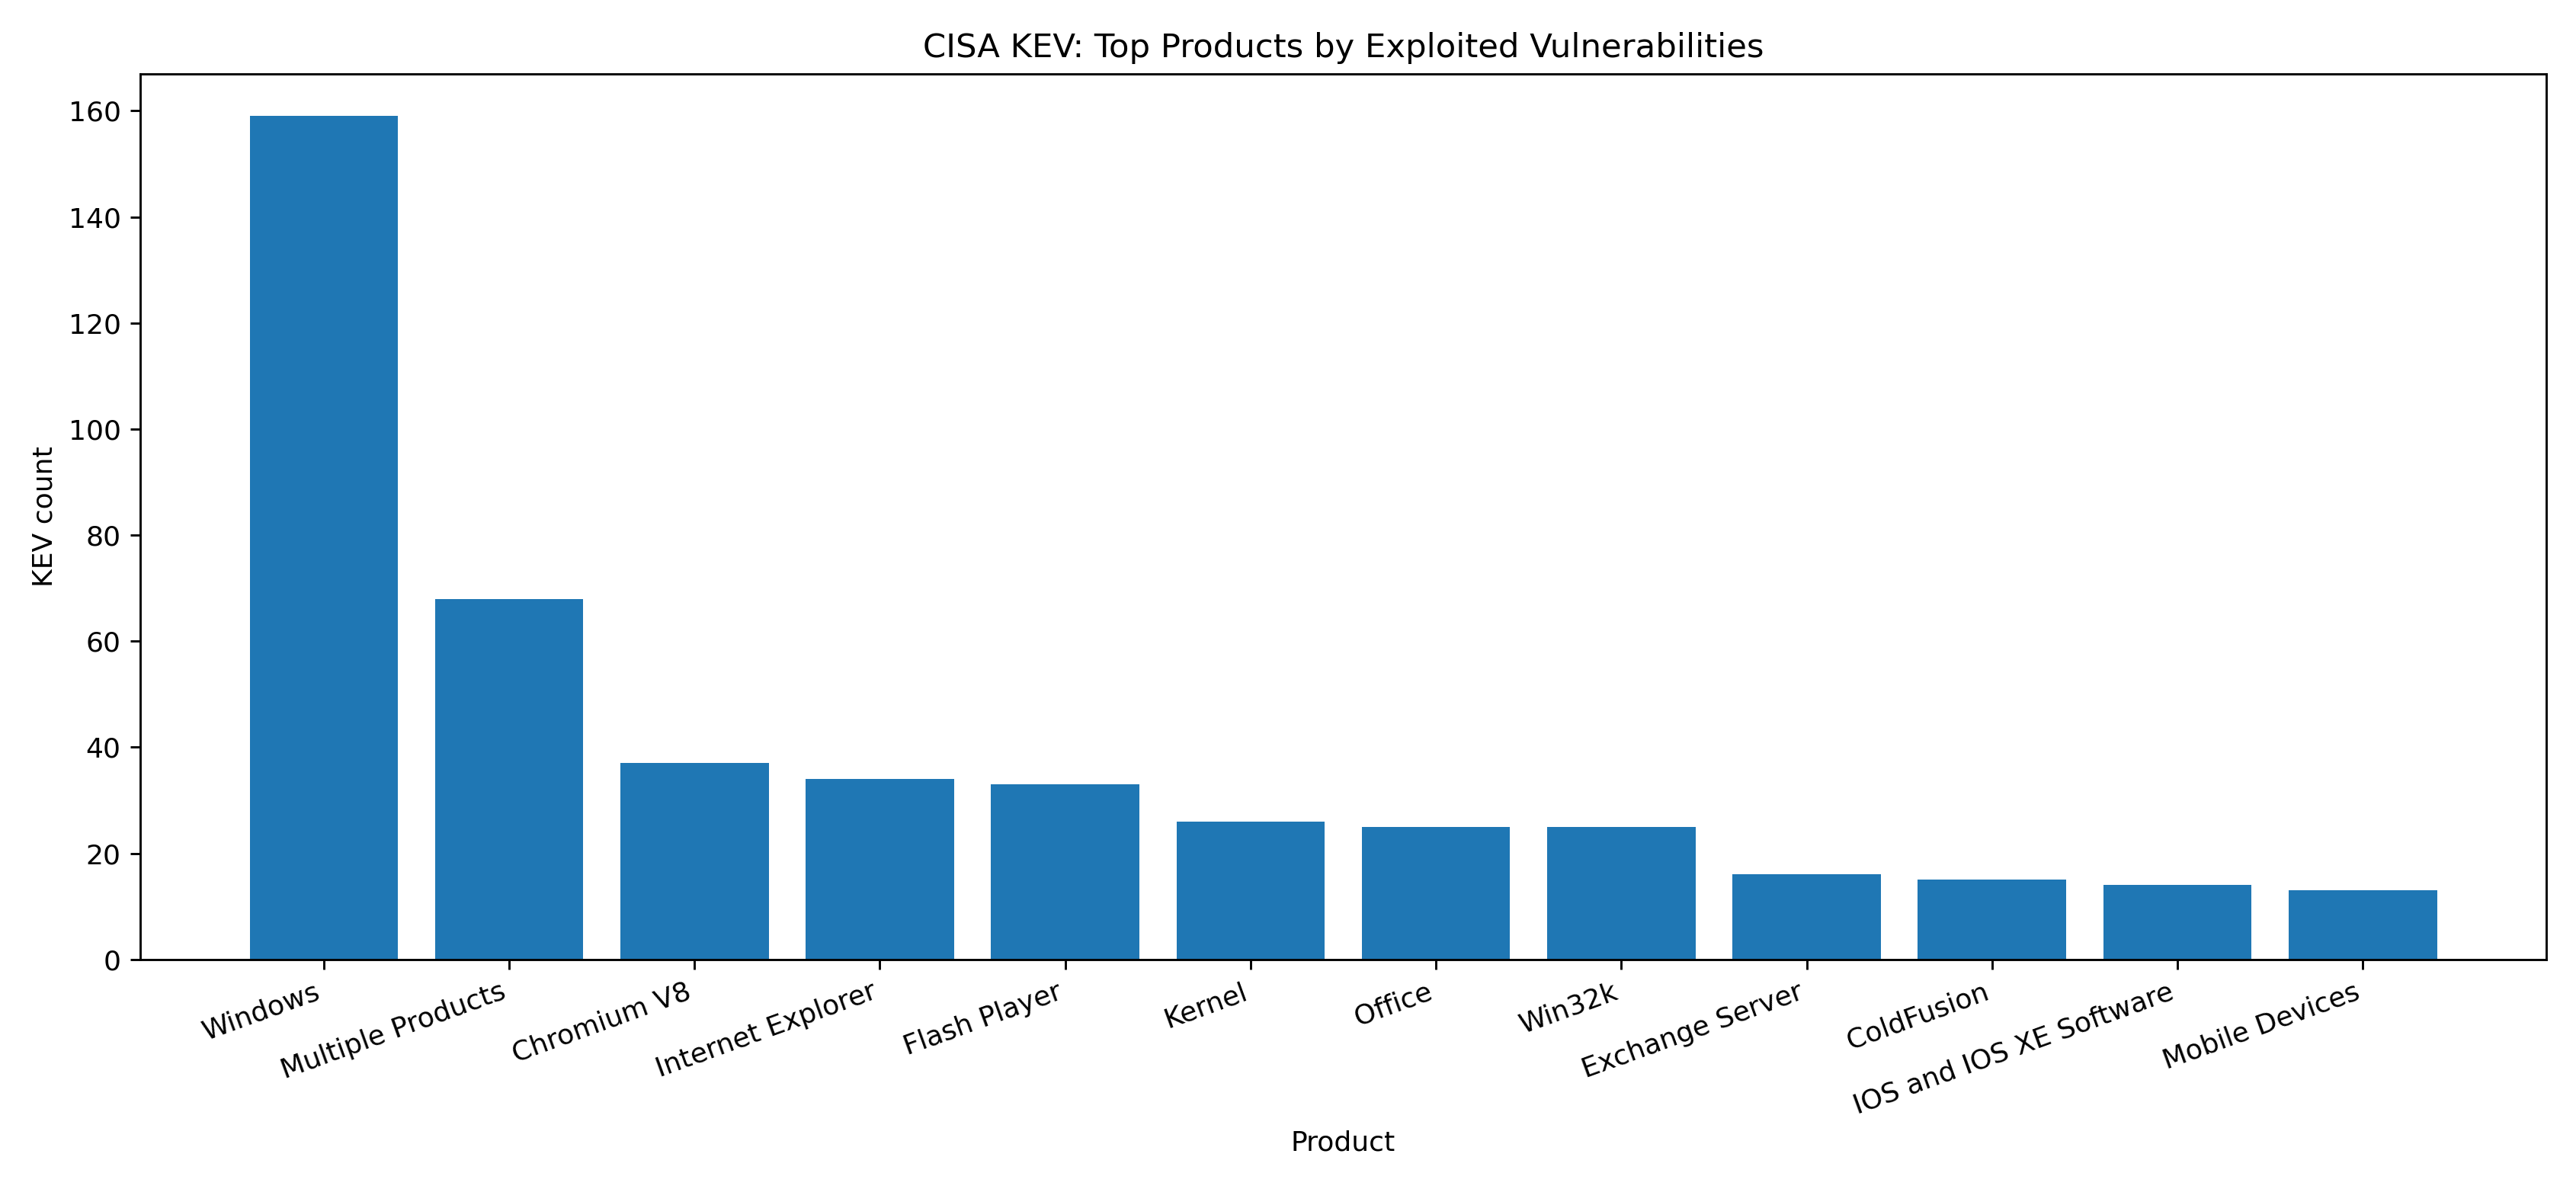
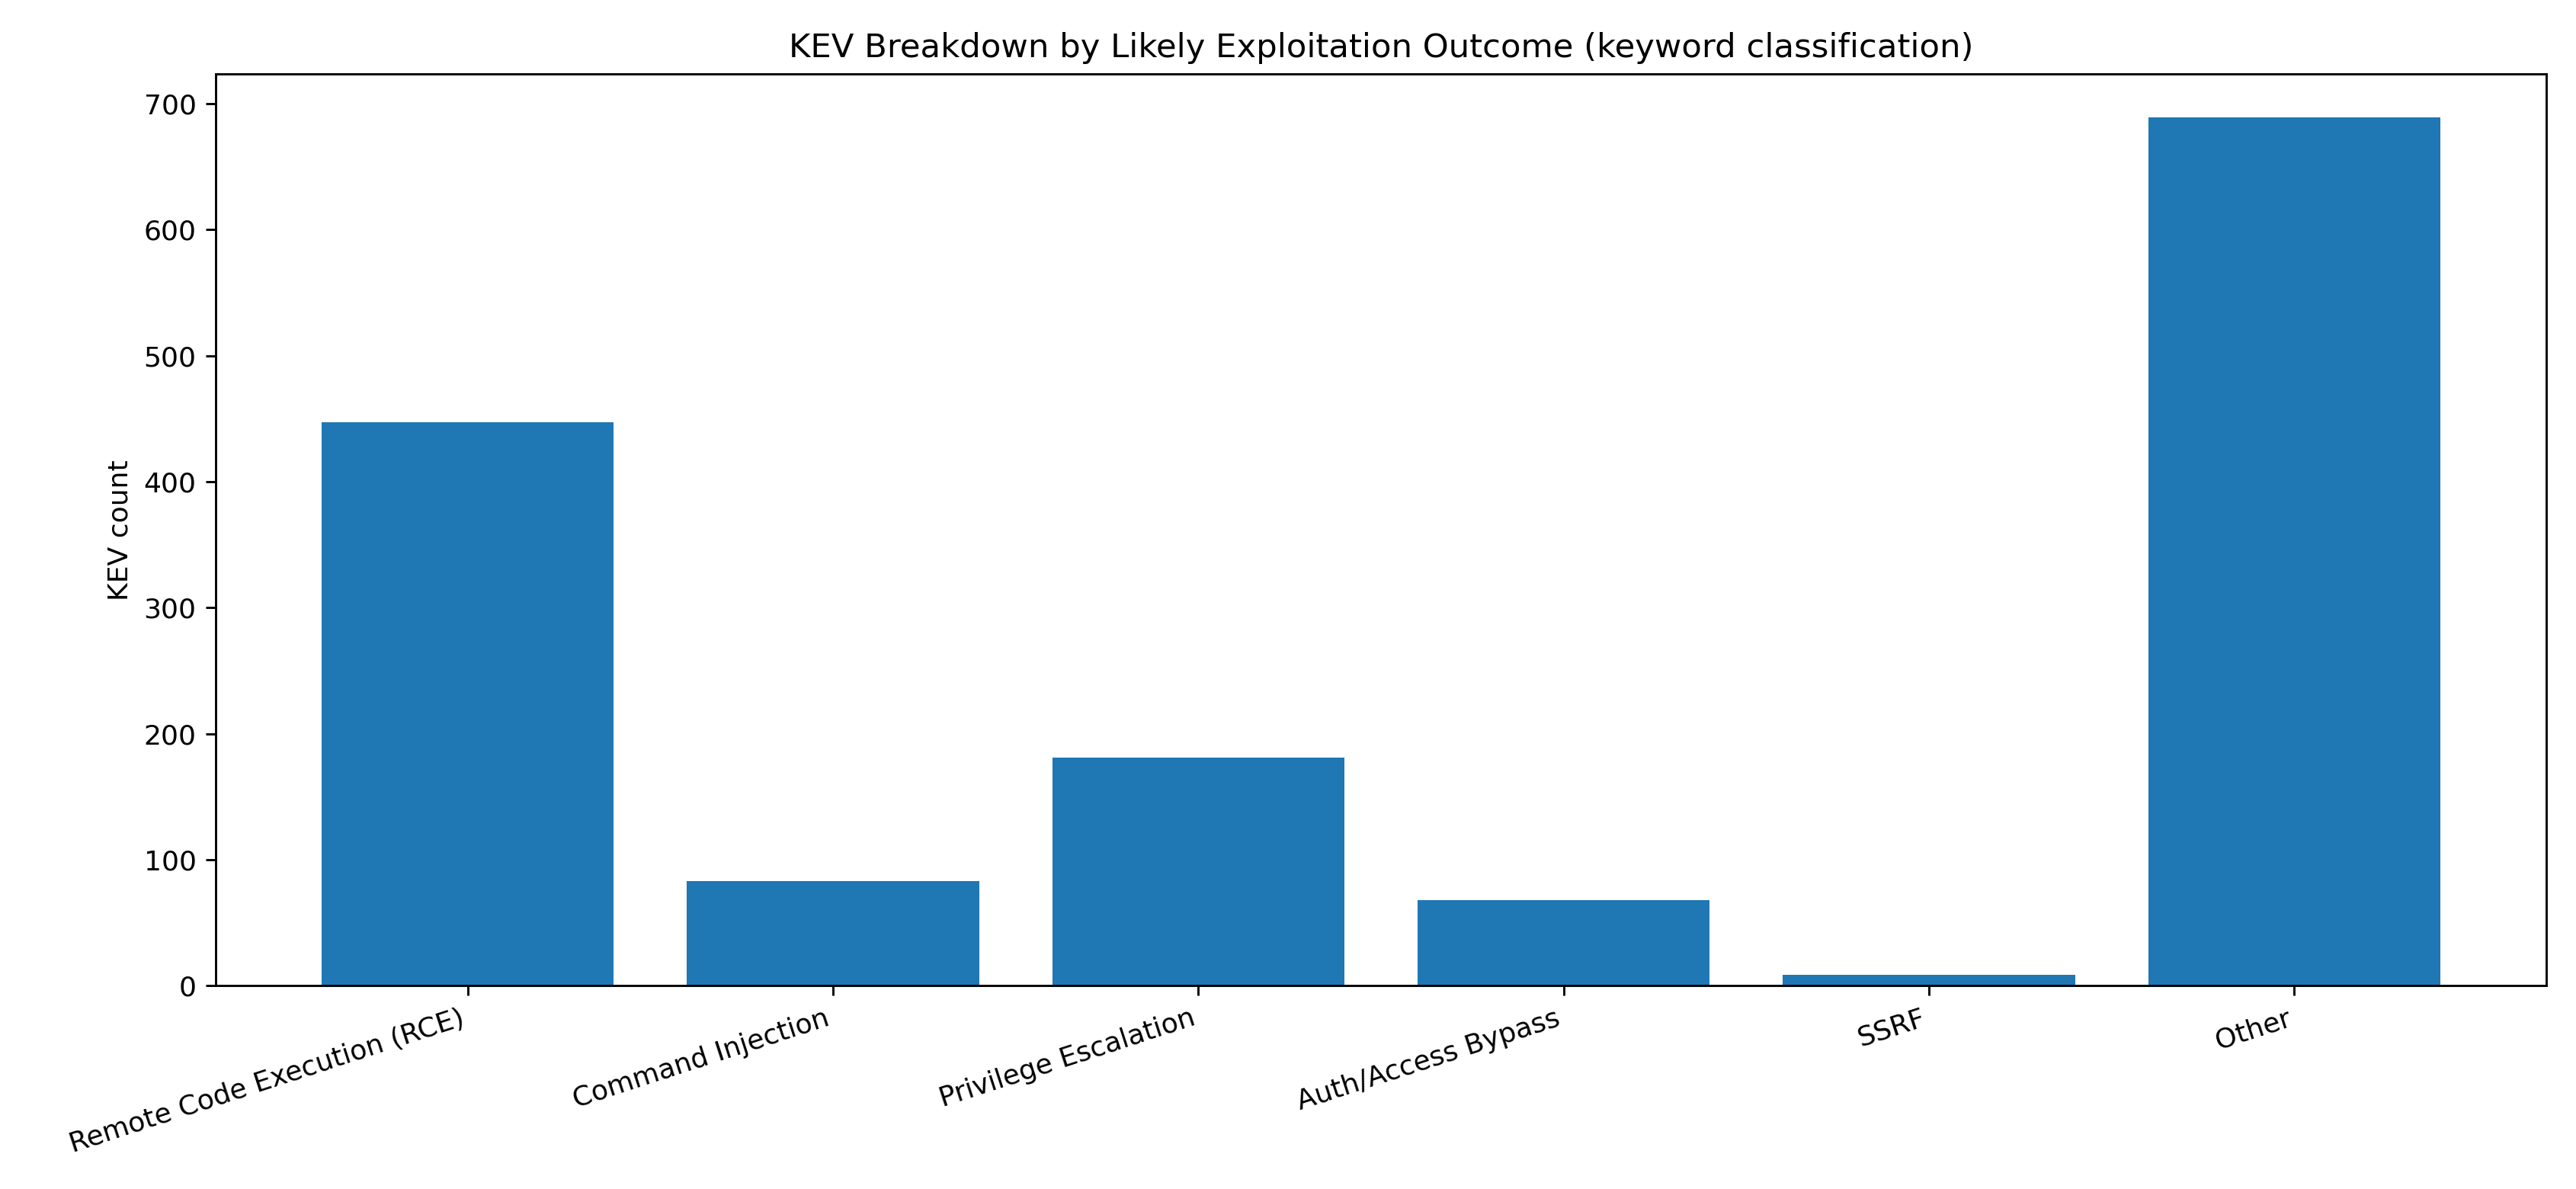
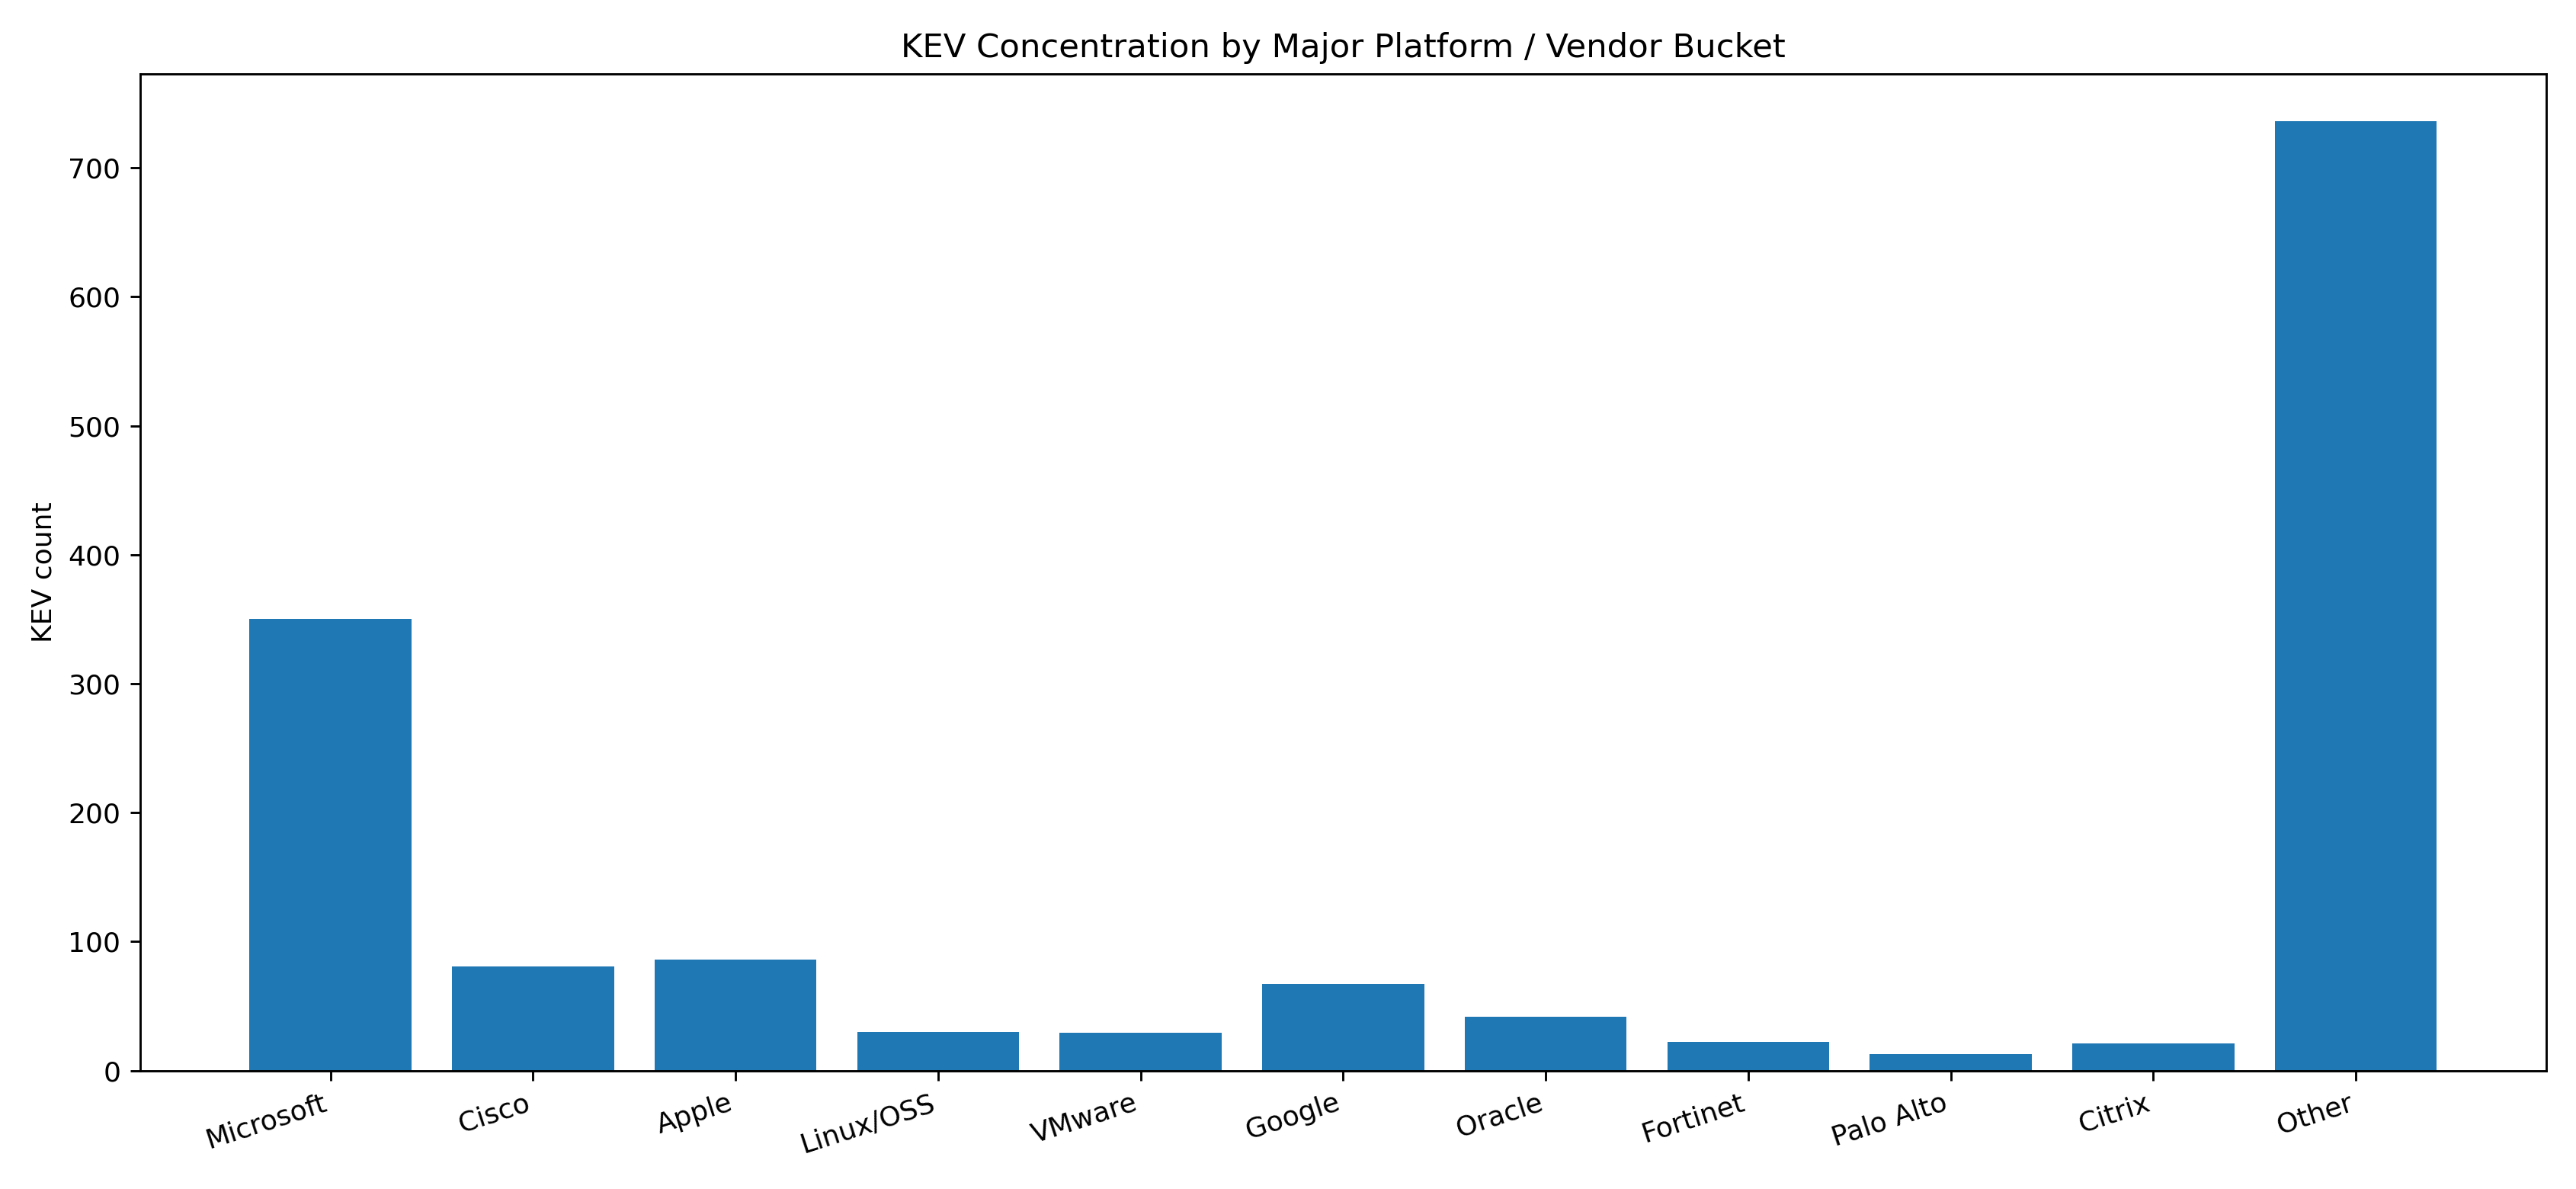
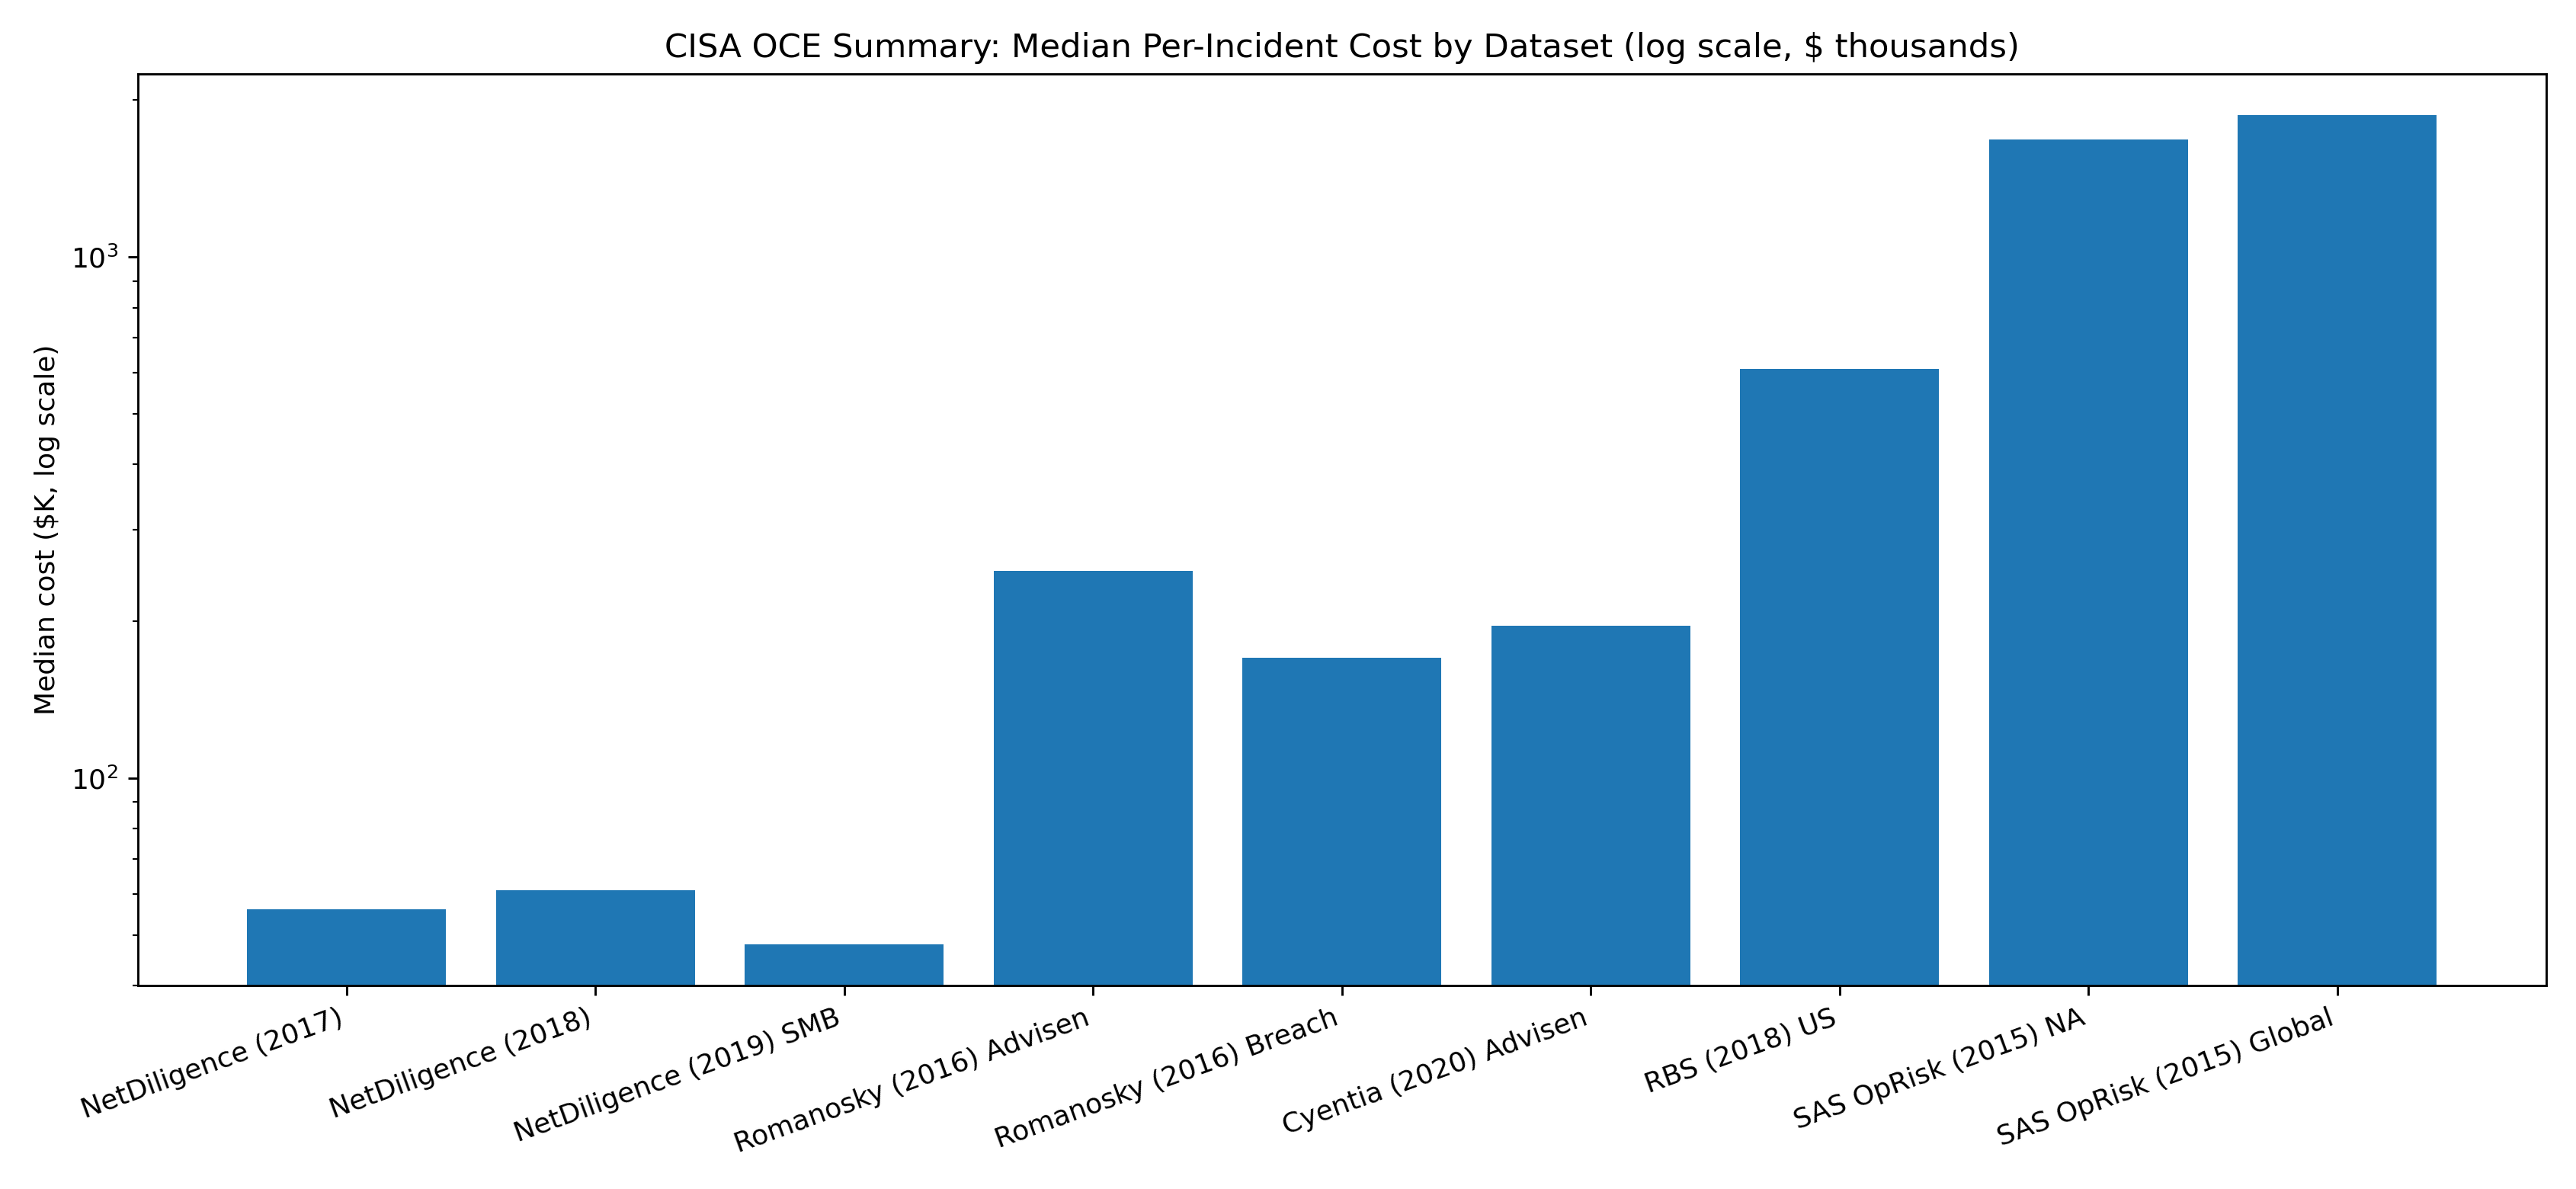
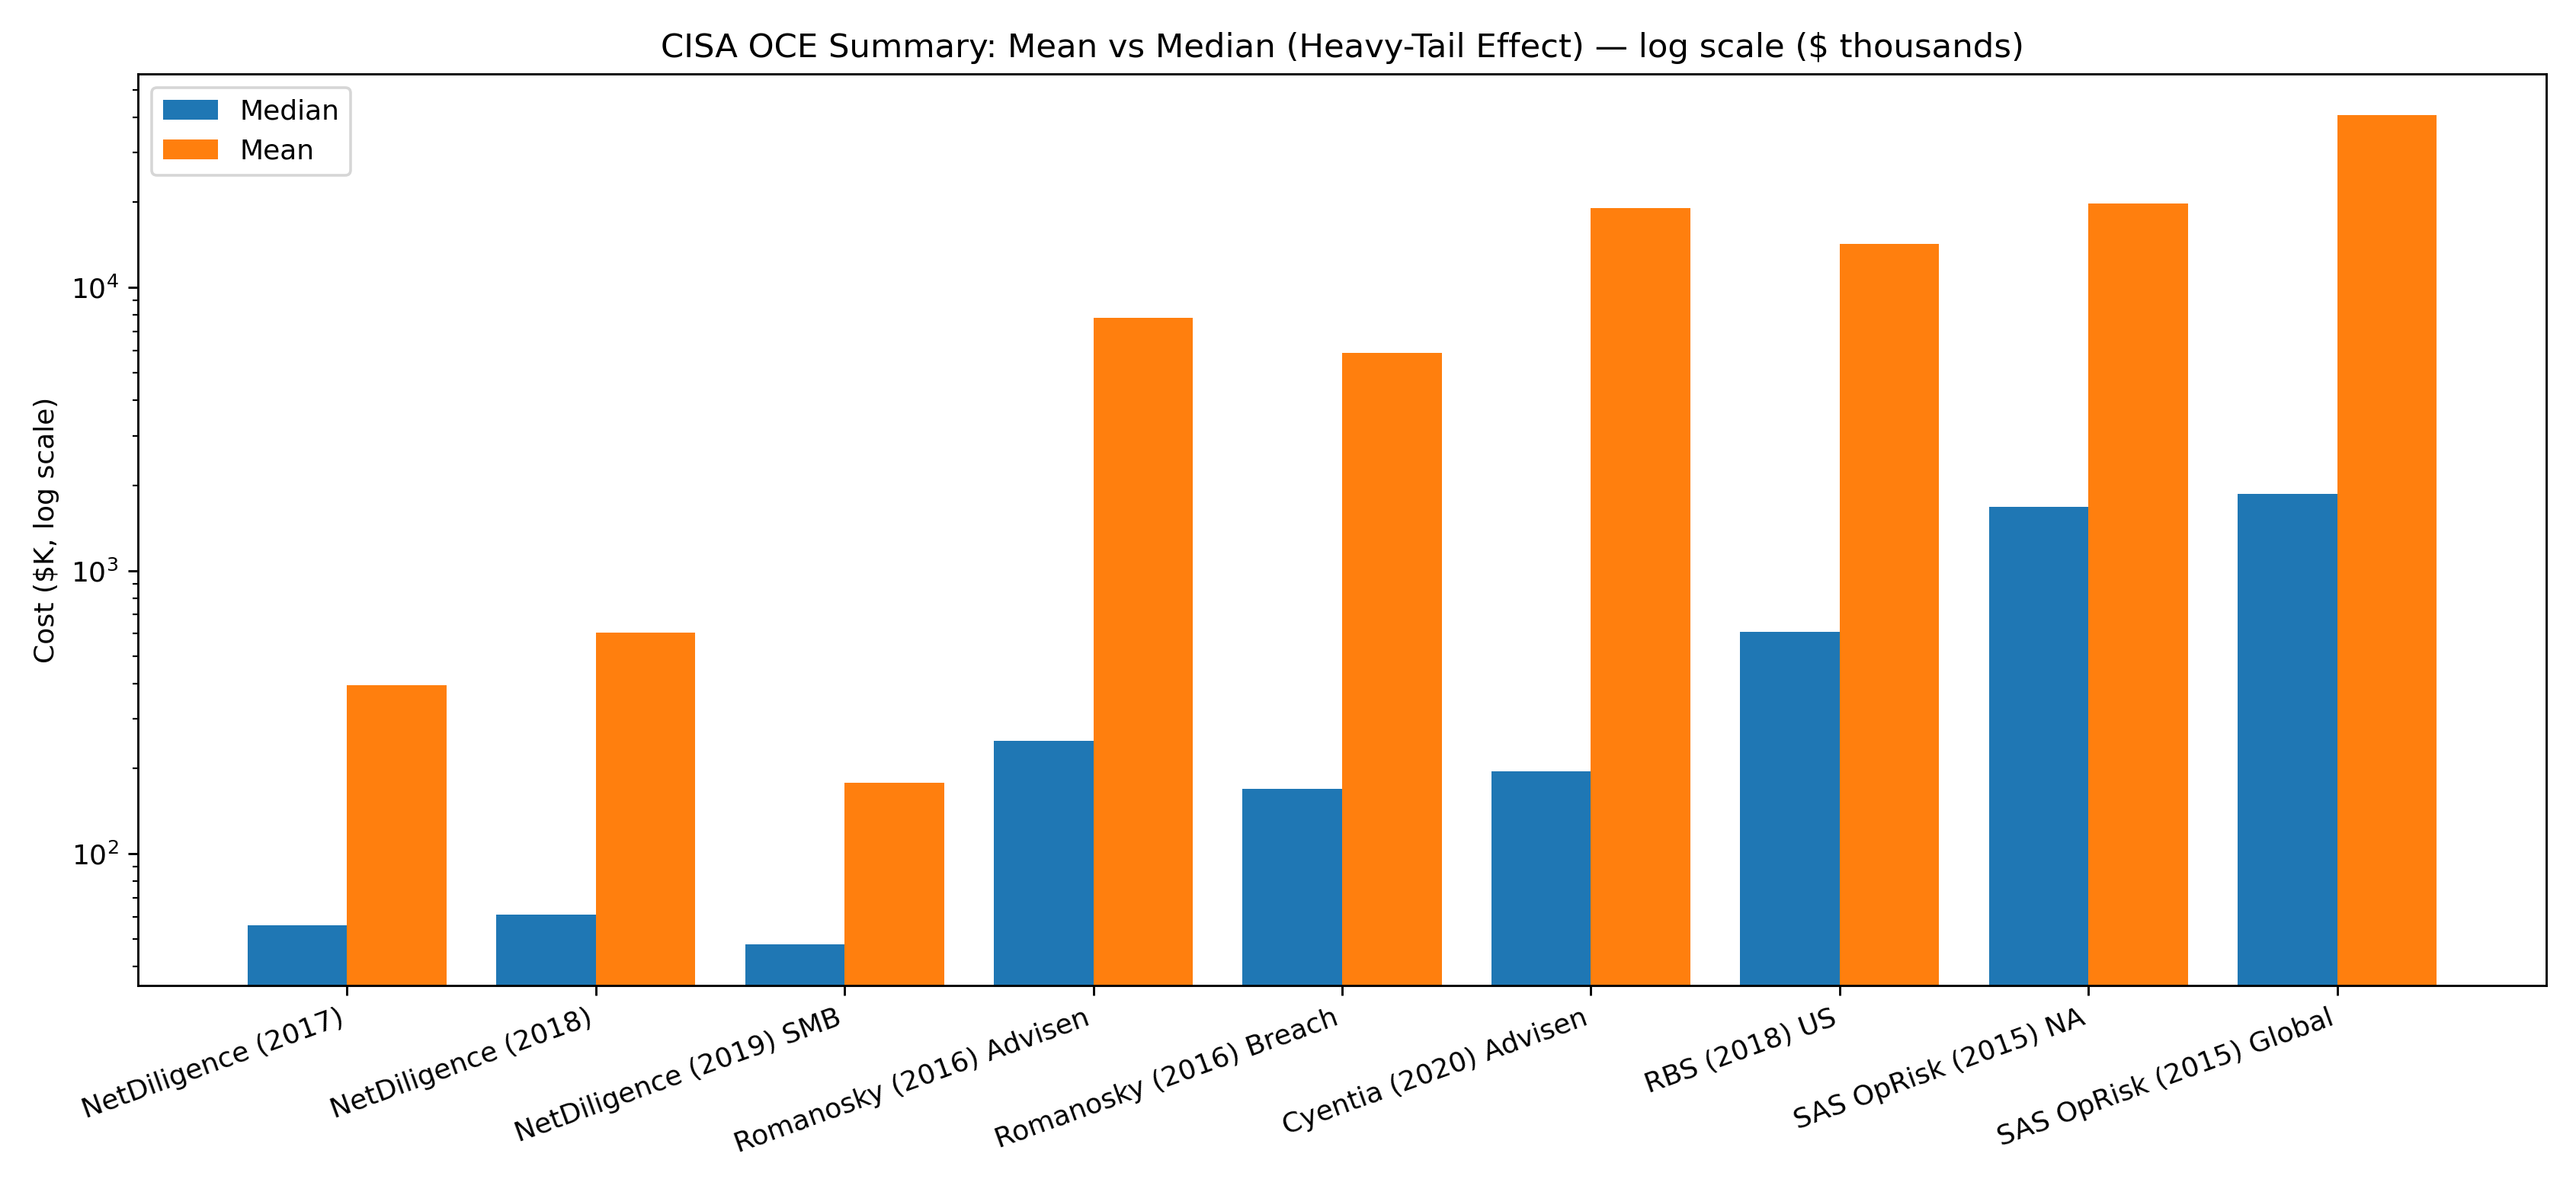
Tap any chart to open it full-size in a new tab. Each chart is downloadable as a clean PDF and PNG.

KEV additions by year
Catalog growth by year (dateAdded).
View full size Download PDF Download PNG
Ransomware-flagged KEVs by year
Used in known ransomware campaigns (flag).
View full size Download PDF Download PNG
Top KEV vendors
Top KEV vendors
Where exploitation concentrates.
View full size Download PDF Download PNG
Top KEV products
Top KEV products
Commonly exploited products.
View full size Download PDF Download PNG
Outcome breakdown
Outcome breakdown
What exploit outcomes imply for recovery complexity.
View full size Download PDF Download PNG
Platform/vendor buckets
Major platform concentration view.
View full size Download PDF Download PNG
Median incident costs (log)
Median per-incident costs across datasets (log scale).
View full size Download PDF Download PNG
Mean vs median (log)
Why “average incident cost” misleads (heavy-tail).
View full size Download PDF Download PNG
Offer: strategy session

Book a strategy session to see how fast you can expect to recover with your current setup — and what changes would materially reduce downtime.